Visualizing
Panels
Now that your robot can send messages to Foxglove we need to choose how to display the data.
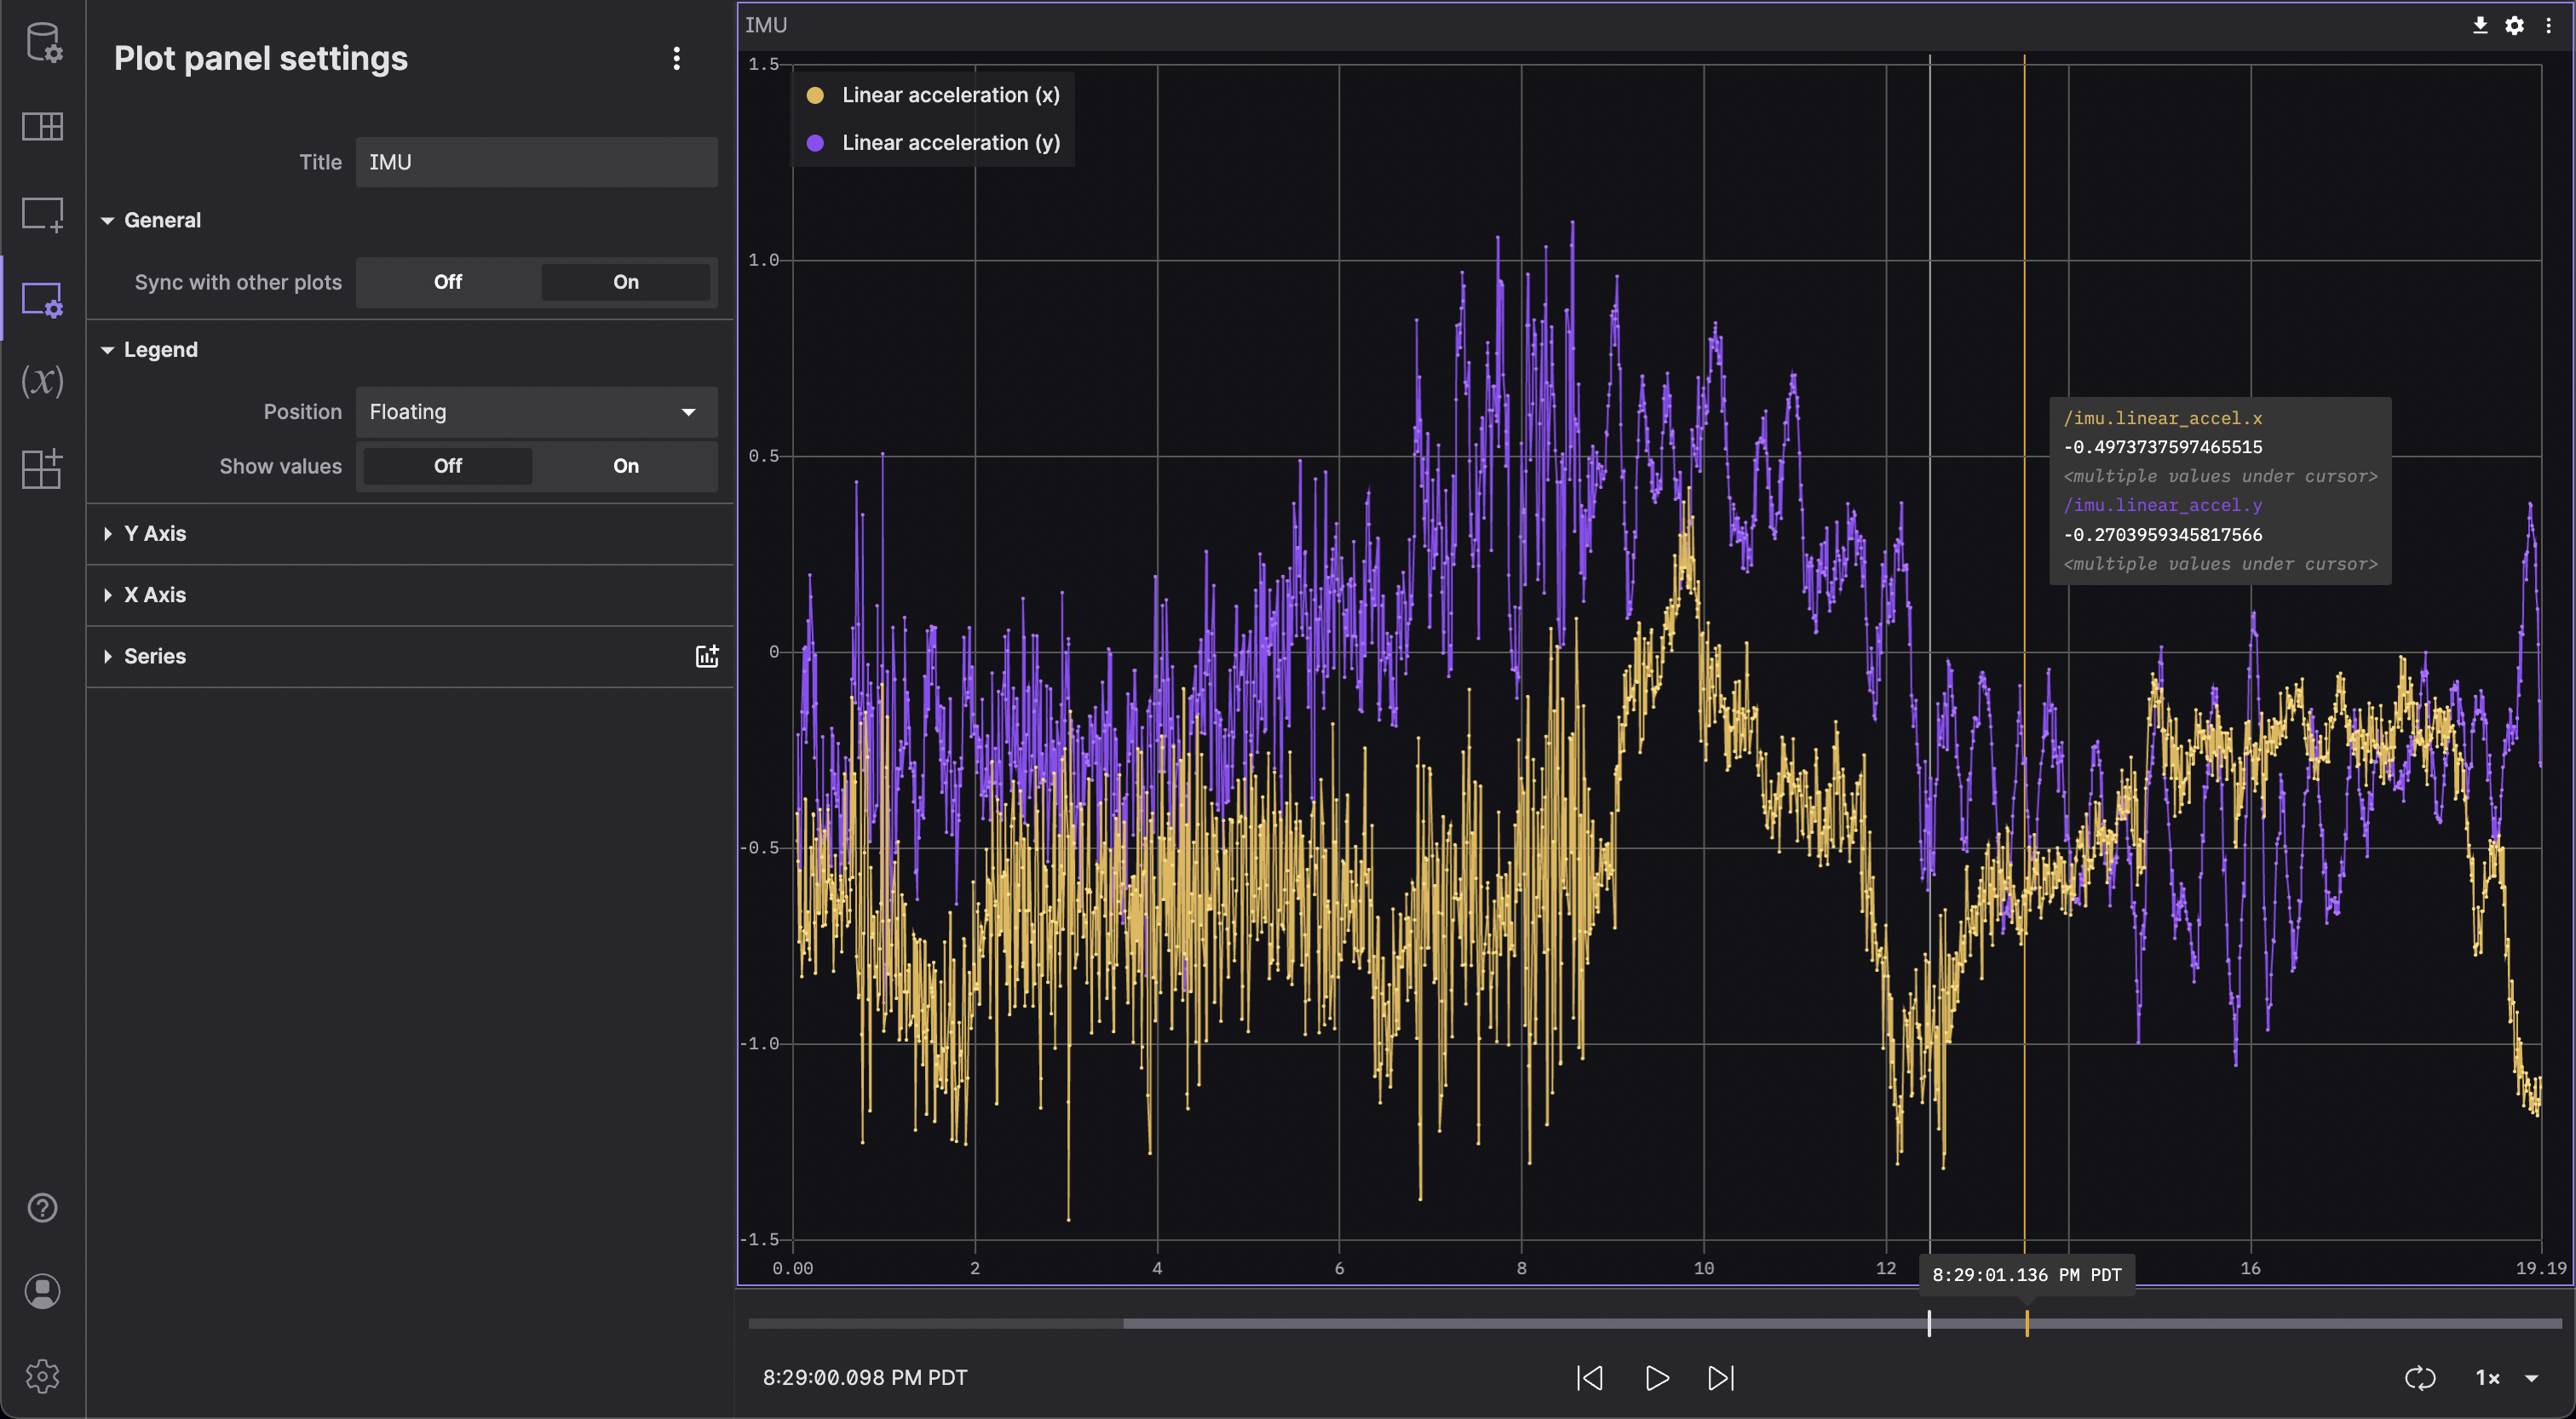
Plot
This panel lets you plot numeric values versus time. For more info, read the official docs.
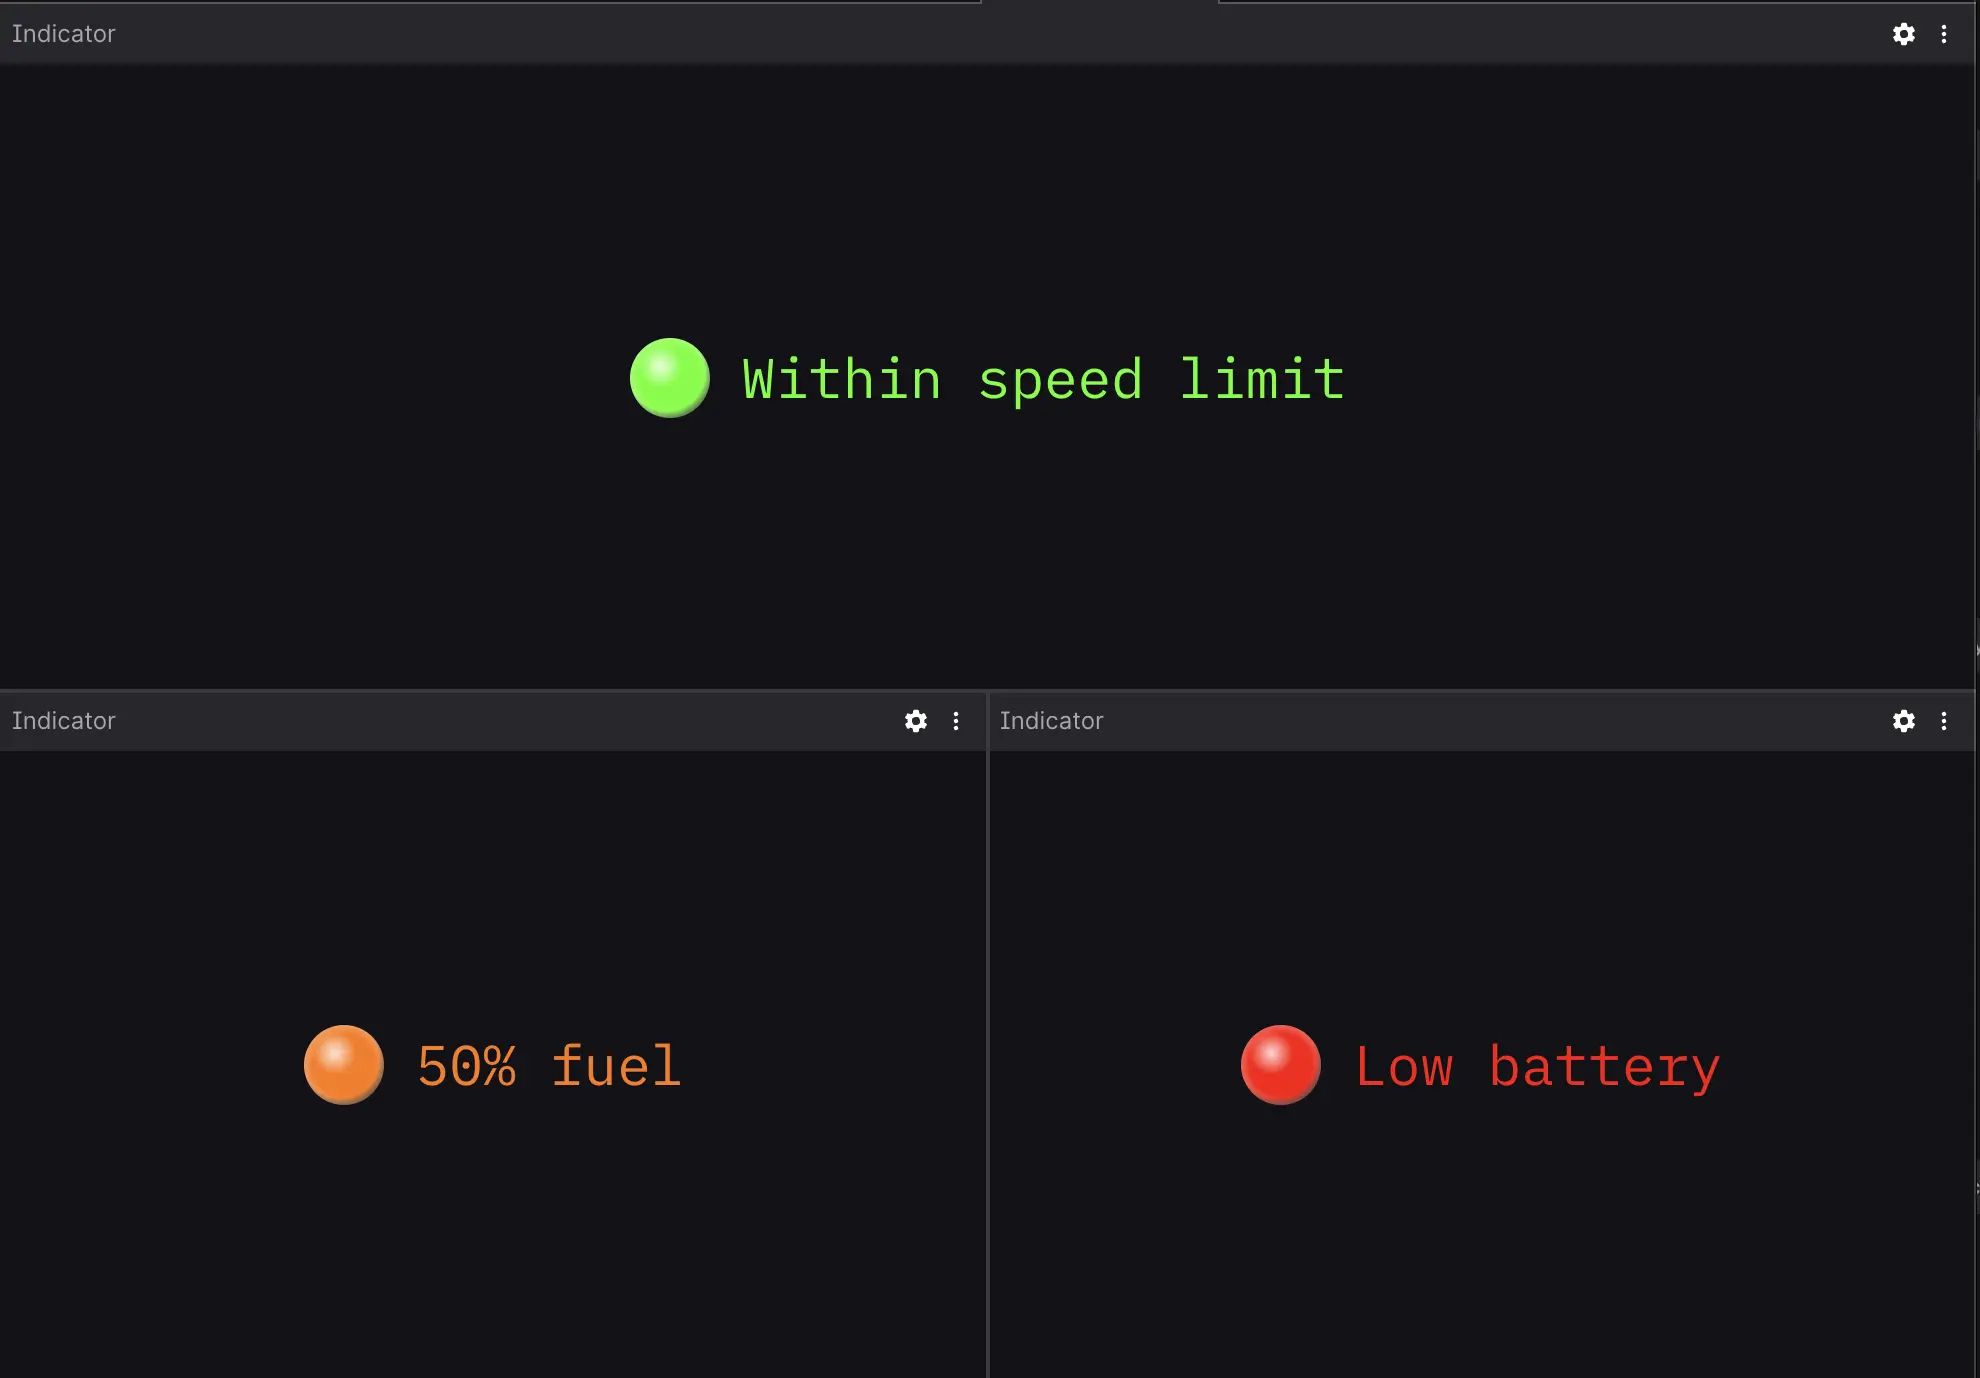
Indicator
This panel displays a color-coded label to indicate a threshold value in your data. For more info, read the official docs.
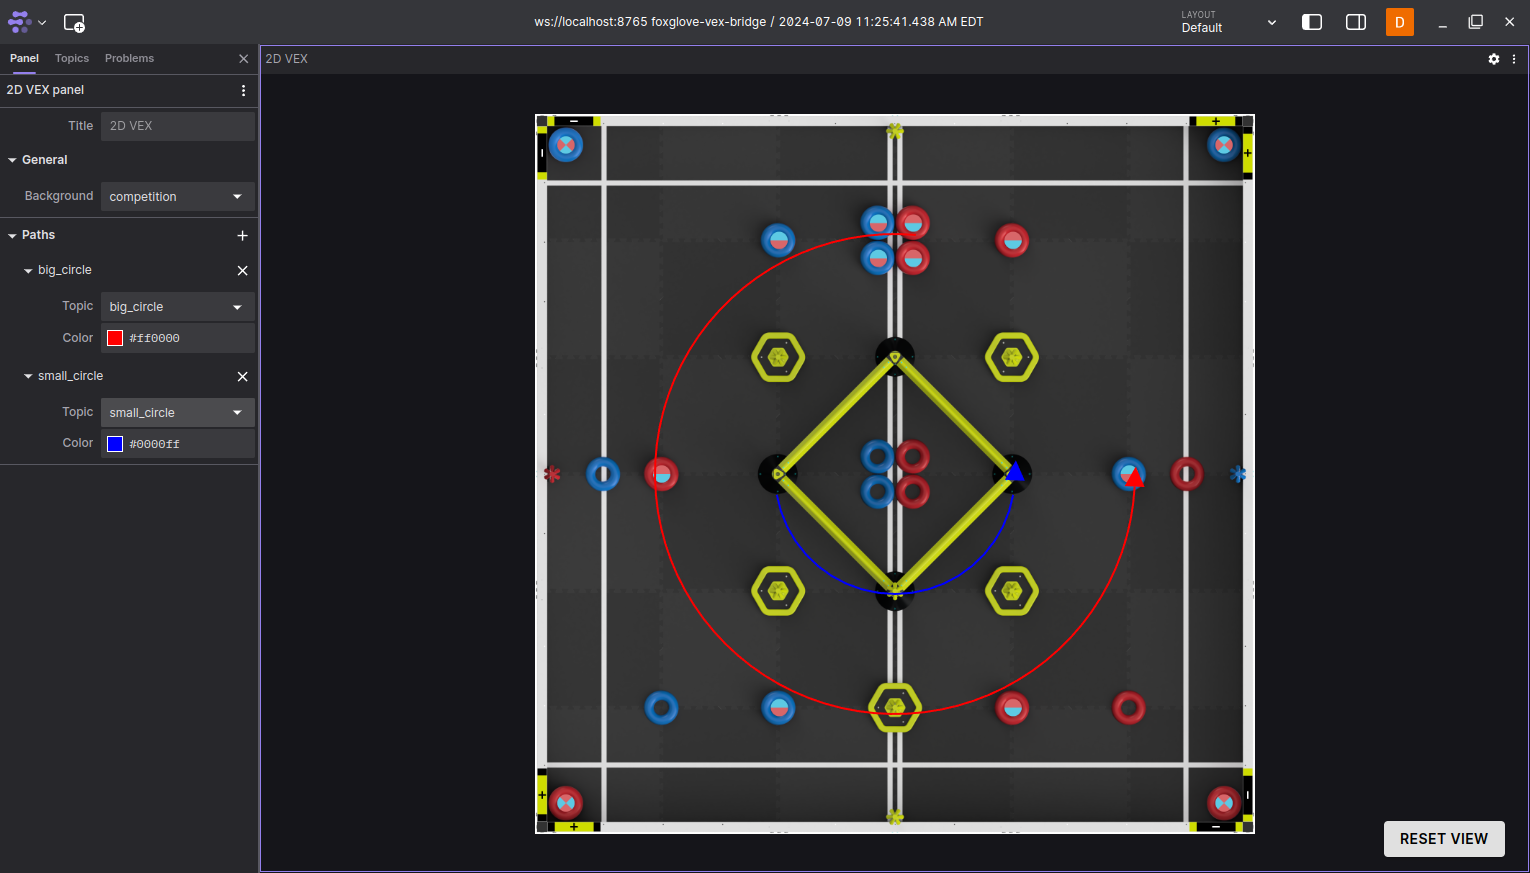
VEX 2D Panel (Custom Panel)
This panel lets you visualize you robot's position and orientation on a VEX field. To use the extension, click on your user icon, then go to extensions and install it from the registry. This panel can only be used with the desktop app.
In order to visualize with the VEX 2D Panel, your messages' payloads must follow the structure below, and your topic name must be "odometry":
// x, y, and heading follow same conventions as https://path.jerryio.com/ / LemLib
struct Odometry {
    double x;
    double y;
    double theta; // heading in radians.
};

inline void to_json(json& j, const Odometry& msg) {
    j = json{{"x", msg.x}, {"y", msg.y}, {"theta", msg.theta}};
}
Use the scroll wheel / trackpad to zoom in and out. Click and drag to move around.
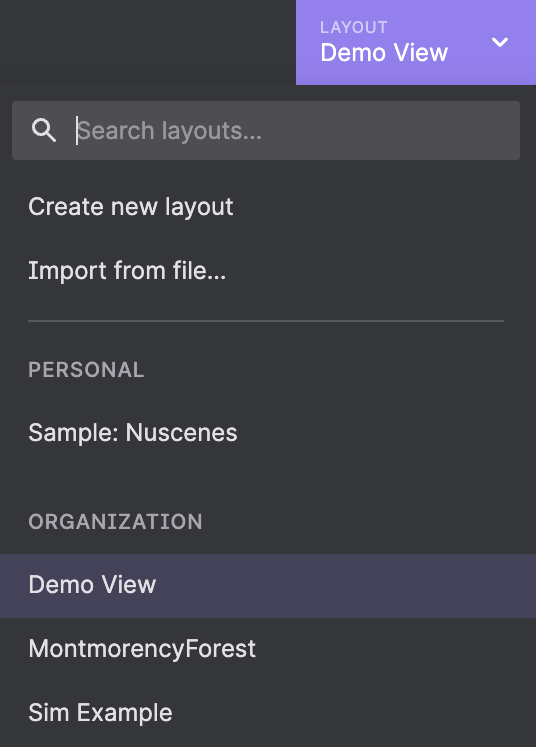
Layouts
Layouts let you remember your workspace (panel arrangement, topics you were listening to) for recurring tasks. For more info, read the official docs.